
Thesis Design Development
Stage 1:
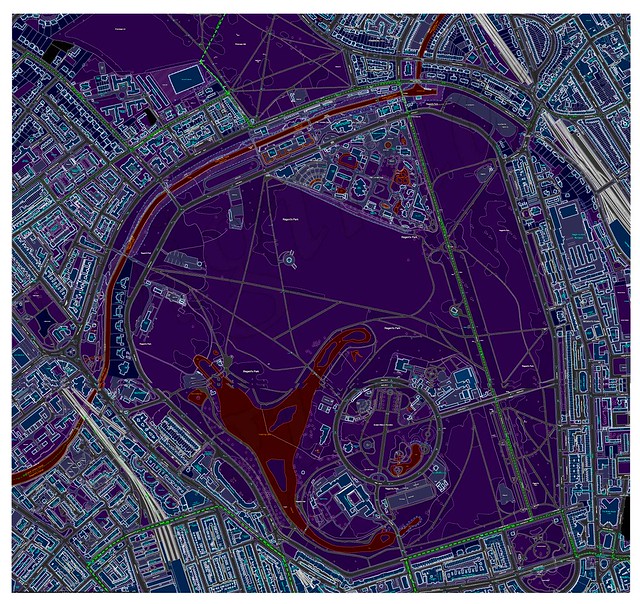
Mapping + Diagramming in Regents Park


__________________________________________________
Thesis Design Development
Stage 2
Devices
Abstract
Observers are men, animals, or machines able to learn about their environment and impelled to reduce their uncertainty about events which occur in it…
As observers we expect the environment to change and try to describe those features that remain unchanged with the passage of time…
An ‘assembly’ is the dynamic part of an observer’s environment, a piece of the real world…
Gordon Pask, An Approach to Cybernetics, 1961
Attempting through diagrams to draw out and analyse recordable or measurable qualities from our environment – or, more specifically, one particular environment – Regent’s Park.
This task aimed to start experimenting with devices that will engage with the real world; devices that tap into the complex sophistication of physical systems; of nature and interaction.
Task
From the Mapping and Diagramming exercise the research of interests had been triggered the response to the conditions found in Regent’s Park.
A digital/technological component was needed. A working device that taps into the environment and responds to it . This device would be the foundation for the thesis project and to build on the subject of the diagramming and mapping in Regent’s Park exercise.
Also Interface boards like Arduino (www.arduino.cc) would provide an ideal mechanism to process data from
outside the box . The device would aim to measure or record, or to intend to enhance or change a perception. It could have been independent or prosthetic.
__________________________________________________
Research on Initial Ideas

__________________________________________________
Making of the Device
Laser cutter components

Process of Making

__________________________________________________
Electronic Components

Information on the electronic components used can be found on the links below:
URM37 V3.2 Ultrasonic Distance Sensor
Arduino Library :
http://www.yerobot.com/forum/index.php?topic=8.0
TTL connection with Arduino :
http://www.yerobot.com/forum/index.php?topic=6.0
Interface with Arduino :
http://www.yerobot.com/forum/index.php?topic=3.0
User’s manual :
http://letsmakerobots.com/files/URM3.2_Mannual_Rev2.pdf
Library:
http://www.milesburton.com/wiki/index.php?title=URM37_Ultrasonic_Distance_Measurement_Library
Heart Beat sensor
Data sheet :
http://www.sunrom.com/files/1157-datasheet.pdf
__________________________________________________
Device
As presented on 14 December 2009

__________________________________________________
Conceptual Processing Sketch and Screen Capture Animations
Here s a processing sketch which was used to illustrate the purpose of the device. To show movement/approach/proximity to an individual’s personal space occupation and invation.
In this sketch there are 4 ellipses, a grid (for movement tracking/position), a curve and the map of Regent’s park.
Each one of these elements has it’s own purpose. Each ellipse is to be moved according to the values received by each Ultrasonic URM Distance sensor.
4 ultrasonic distance sensors = 4 ellipses. Therefore the measurements would be received from the front-back-left right.
1 heart beat sensor = curve
The moving curves are to be moved from the values received from the Heart beat sensor. The user holds the device where the Heart beat sensor is placed. In turn according to approach and the visual manipulation of it through the top of the device, the Kaleidoscope, the Heart Beat changes according to the users personal feelings, of what the users visual experience is when the personal spaces minimilized or invaded and the view mirrored and reflected through the kaleidoscope.
Through the Kaleidoscope, the case is that the personal space is not invaded. But the kaleidoscopic effect creates an illusion. The feelings created from this illusion would be recorded by the heart beat sensor.
This is a conceptual sketch of what the ambition was. Unfortunately I haven’t worked out the code yet in processing to control the direction and movement of those elements, and I still need to modify the Arduino code in order to receive values from all 4 sensors plus the heart beat. If this succeeded, then the illustration will be the desired effect. It’s a challenge!
What’s with the pixelized Regent’s park map? The pixels are formed commencing where the mouse goes and in addition the ratio in which they are formed is controlled by the mouse speed. The reason I carried out this was because at the very beginning (Mapping and Diagramming in Regent’s park) I have came across at various speeds of movement, therefore the direction and position of an approach would be mapped on this sketch as to present a better understanding and results of the conclusion. So…(and another)…pixels would be formed from the movement of the emitting ellipses by the sensors. Thus, proximity to the user as on the map, could have been revealed.
Unfortunately the ellipses and curves in this sketch are moving randomly. There is only one part of emitting ellipses moving with the mouse. If indeed the movement of those elements was from the sensor values then the illustration would give the desired end result and understanding.
Worth mentioning, is that another idea was that the device would be programmed to rotate/turn to the direction where a value was minimised, so that the user would be able to get a signal that there is an approach of an object/event/person from that particular direction. This could have been done with a motor. Or perhaps some leds to blink and then the user would rotate the device manually. Just a thought….
Following is sequence of several very rough screen captures in Maya, in different inspections, to demonstrate what the conclusion could have comprised if all electronic components provided a certain rate of measurements, and the arduino code as well as the processing sketch were modified successfully.
__________________________________________________
Staging
Environment – Visual Experience – Repetitive Proximity


Technical


__________________________________________________
Look Through

__________________________________________________
Graphs from Sensor Measurements

__________________________________________________
A First Experimental Optical Illusion and Visual Manipulation
Sensor combination effects
+An Early very first Experiment+
Optical Illusions and Visual Manipulation

Early experiment
Using the data from the sensors it has been an attempt to use the graphics made in processing of the data received and to use them to represent objects seen and found. In fact the data from the distance sensor does indeed represent objects since it is received based of objects in front of the distance sensor. The initial purpose was to represent theproximity surround of personal space invasion. Circles have been used to confirm how personal space can be decreased when distance is minimalized and how an individual may possibly feel the enclosure. This is revealed by the rings increased and decreased in stratums of colour.
In addition it has moreover been an attempt to illustrate the multiplied distorted consequence of view through the kaleidoscope and the manner of perception one can be affected for when the view is distorted and perception is misapprehended.
To begin with in Adobe Pemier I have divided my video working screen in to 2 parts.
The animation was made from only 1 sequence of measurements. The initial sequence is the left ring. Then the same exactly animation was placed on the right sde but used slightly different colours For example red was first used in the left side and blue on the right site.
What’s more is the increase and decrease of the rings on both sides, left and right are equal. One may think that are or are not due to the colours. Visual Perception for each individual is different. However….The red ring on the left side is the same as the blue ring on the other side. There fore the illusion is that are not equal where in reality they are.. Also the colours do not appear at the same time in the left as in the right part. So there is the illusion that what is happening on the left side is not the same on the right. The fact that the circles increasing and decreasing is not happening at the same is obvious at the beginning due to the selection of colours as stated earlier but towards the end they are the same but give the illusion that they are not.
Here is the video :
__________________________________________________
First Thesis Idea for Research Proposal – Abstract

Based on the work carried out in Semester 1 (Thesis Design Development), personally one of the most important functioned conclusions through out the making of the device and through most of the work in Semester 1, when building the device, and yet more importantly while carrying out the research behind it, when taking measurements through the distance sensors and through the heart beat sensors, and last but more important when looking through the top part of the device , my own version of kaleidoscope with the reflective materials not just from the inner part of it but also from the external part, I have concluded that the brain or our nervous system has a corresponding point for every possible visual reaction that it is possible to spot.
The kaleidoscope reflecting and manipulating the vision and further more minimalising the distance to what was perceived helped me to indicate how the perception is twisted and everything changes organically. It created the question of is what you see? What you believe? Or is it what you see the actual or real of what you see? Or perhaps there is no clear understanding and perhaps it needs a better organization. Is organizing perceptual experience is better that to predict and control the actions and outcomes one can get from it and how it affects them personally then what is the way of doing that?
Our eyes collect and organize information points into sets and sending them to the brain/nervous system, whatever. The brain seems to obtain patterns from the received information sets. Data sets which it receives repeatedly form stronger and stronger patterns. Over time, the brain seems to collect so much data from particular areas that it begins to shut down the invasion of new information, because it believes that it already has enough information from them to predict and control outcomes of actions. I believe that this is how the perception of the optical illusions work. The Repeated visual and more importantly manipulated information set into patterns, which eventually are relied on own logical perception of the perceived information to adapt. This might mean that that the information received is replaced with either an image or reality or our perception is replaced with conception. So are perceptions governed by conceptions and visual illusion?
Vision has an immediate response with distance. What you see is how clear you can see it and the clearer the better is the understanding. In the case of the visual illusion or visual manipulated perception due to the illusion that in this case is caused by the kaleidoscope , it may be argued that there is no distance. Objects are in false positions and the multiplied reflections through the kaleidoscope are making the distant position of those objects false. So is manipulated vision minimalizing distance? Looking at 3d perspective drawings we can see that most are drawn based on a vanishing point. That point is the end distance of what artificially the eye can see to collect the information. The vanishing point is something that all have experienced with it when we try to see or look at something in order to understand a location or to calculate the distance in which that particular something of our desire exists. This brings me to my final thought for a thesis project proposal which I will try to bring out through a question. Is visual illusion of manipulated vision minimilizing distance? and if so? Is this the end of the perspective?
Some questions for research and further investigation follow :
How does visual perception reflects central inner object relations.. Is it merely projections of content? Of form? Or is it ingrained in the whole personality, and in that respect revealing a mode of functioning which spreads out to cognitive as well as emotional areas? Are the tools for creating illusions of three dimensional space overlapping, changing size and placement, linear perspective, relative hue and value, and atmospheric perspective. Ways and opportunities of developing the issue and experimenting further with the question as in turn to come with a proof of the occurrences of how this may happen is the use of visual schematics, further investigation of visual illusion as well as physical or computational experiments and through further manipulation of the kaleidoscopic tool or effect.
___________________________________________________________________________
Research on subject of interest prior to Thesis Proposal

Bibliography
- Suspensions of perception: attention, spectacle, and modern culture By Jonathan Crary, page 57
- Techniques of the observer: on vision and modernity in the nineteenth century By Jonathan Crary, Page 68-69
- Visual illusions: their causes, characteristics and applications By Matthew Luckiesh, Page 196
- [Images from various web resources]
__________________________________________________
Through Device’ Building Geometry
 https://marialardi.com/2010/02/05/through-device-building-geometry/

Nice. Greetings from the Speedy DNS
Outstanding write-up, keep the fantastic work.
I’m a Senior Lecturer within the Cultural Studies department at Central Saint Martins in which I’m also functioning with a project for the marketplace.
great one buddy maintain it coming