

THESIS DESIGN DEVELOPMENT
DEVICES
ABSTRACT
Observers are people, animals, or machines able to learn about their environment and impelled to reduce their uncertainty about events which occur in it…
As observers we expect the environment to change and try to describe those features that remain unchanged with the passage of time…
An ‘assembly’ is the dynamic part of an observer’s environment, a piece of the real world…
Gordon Pask, An Approach to Cybernetics, 1961
Attempting through diagrams to draw out and analyse recordable or measurable qualities from our environment – or, more specifically, one particular environment – Regent’s Park.
This task aimed to start experimenting with devices that will engage with the real world; devices that tap into the complex sophistication of physical systems; of nature and interaction.
TASK
From the Mapping and Diagramming exercise the research of interests had been triggered the response to the conditions found in Regent’s Park.
A digital/technological component was needed. A working device that taps into the environment and responds to it . This device would be the foundation for the thesis project and to build on the subject of the diagramming and mapping in Regent’s Park exercise.
Also Interface boards like Arduino would provide an ideal mechanism to process data from outside the box . The device would aim to measure or record, or to intend to enhance or change a perception. It could have been independent or prosthetic.
Device as presented on 14 December 2009

Device [Look Through]


Environment – Visual Experience – Repetitive Proximity


Technical

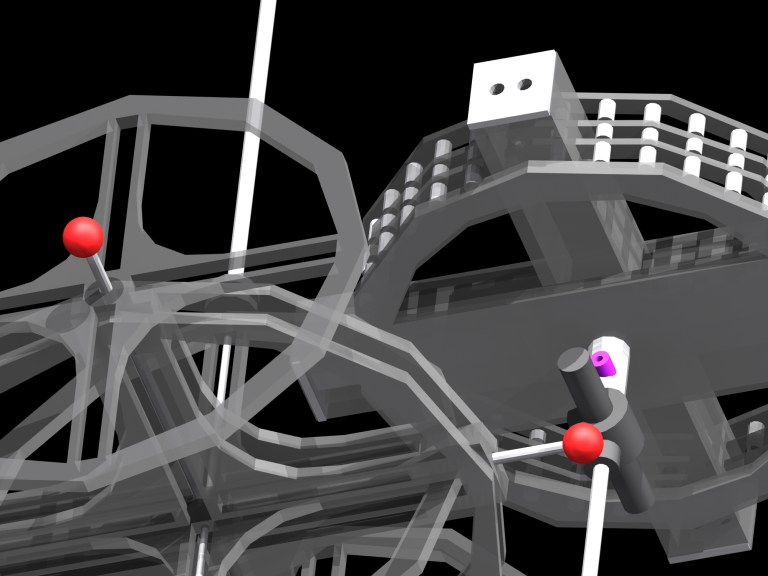
Device [Conceptual Processing Sketch]
Here s a processing sketch which was used to illustrate the purpose of the device. To show movement/approach/proximity to an individual’s personal space occupation and invation.
In this sketch there are 4 ellipses, a grid (for movement tracking/position), a curve and the map of Regent’s park.
Each one of these elements has it’s own purpose. Each ellipse is to be moved according to the values received by each Ultrasonic URM Distance sensor.
4 ultrasonic distance sensors = 4 ellipses. Therefore the measurements would be received from the front-back-left right.
1 heart beat sensor = curve
The moving curves are to be moved from the values received from the Heart beat sensor. The user holds the device where the Heart beat sensor is placed. In turn according to approach and the visual manipulation of it through the top of the device, the Kaleidoscope, the Heart Beat changes according to the users personal feelings, of what the users visual experience is when the personal spaces minimilized or invaded and the view mirrored and reflected through the kaleidoscope.
Through the Kaleidoscope, the case is that the personal space is not invaded. But the kaleidoscopic effect creates an illusion. The feelings created from this illusion would be recorded by the heart beat sensor.
This is a conceptual sketch of what the ambition was. Unfortunately I haven’t worked out the code yet in processing to control the direction and movement of those elements, and I still need to modify the Arduino code in order to receive values from all 4 sensors plus the heart beat. If this succeeded, then the illustration will be the desired effect. It’s a challenge!
What’s with the pixelized Regent’s park map? The pixels are formed commencing where the mouse goes and in addition the ratio in which they are formed is controlled by the mouse speed. The reason I carried out this was because at the very beginning (Mapping and Diagramming in Regent’s park) I have came across at various speeds of movement, therefore the direction and position of an approach would be mapped on this sketch as to present a better understanding and results of the conclusion. So…(and another)…pixels would be formed from the movement of the emitting ellipses by the sensors. Thus, proximity to the user as on the map, could have been revealed.
Unfortunately the ellipses and curves in this sketch are moving randomly. There is only one part of emitting ellipses moving with the mouse. If indeed the movement of those elements was from the sensor values then the illustration would give the desired end result and understanding.
Worth mentioning, is that another idea was that the device would be programmed to rotate/turn to the direction where a value was minimised, so that the user would be able to get a signal that there is an approach of an object/event/person from that particular direction. This could have been done with a motor. Or perhaps some leds to blink and then the user would rotate the device manually. Just a thought….
Device [Making]


Electronic components

Information on the electronic components used can be found on the links below:
URM37 V3.2 Ultrasonic Distance Sensor
Arduino Library :http://www.yerobot.com/forum/index.php?topic=8.0
TTL connection with Arduino :http://www.yerobot.com/forum/index.php?topic=6.0
Interface with Arduino :http://www.yerobot.com/forum/index.php?topic=3.0
User’s manual :http://letsmakerobots.com/files/URM3.2_Mannual_Rev2.pdf
Library:http://www.milesburton.com/wiki/index.php?title=URM37_Ultrasonic_Distance_Measurement_Library
Heart Beat sensor
Data sheet : http://www.sunrom.com/files/1157-datasheet.pdf
